Nix Toolkit app feature:

Quality control & history

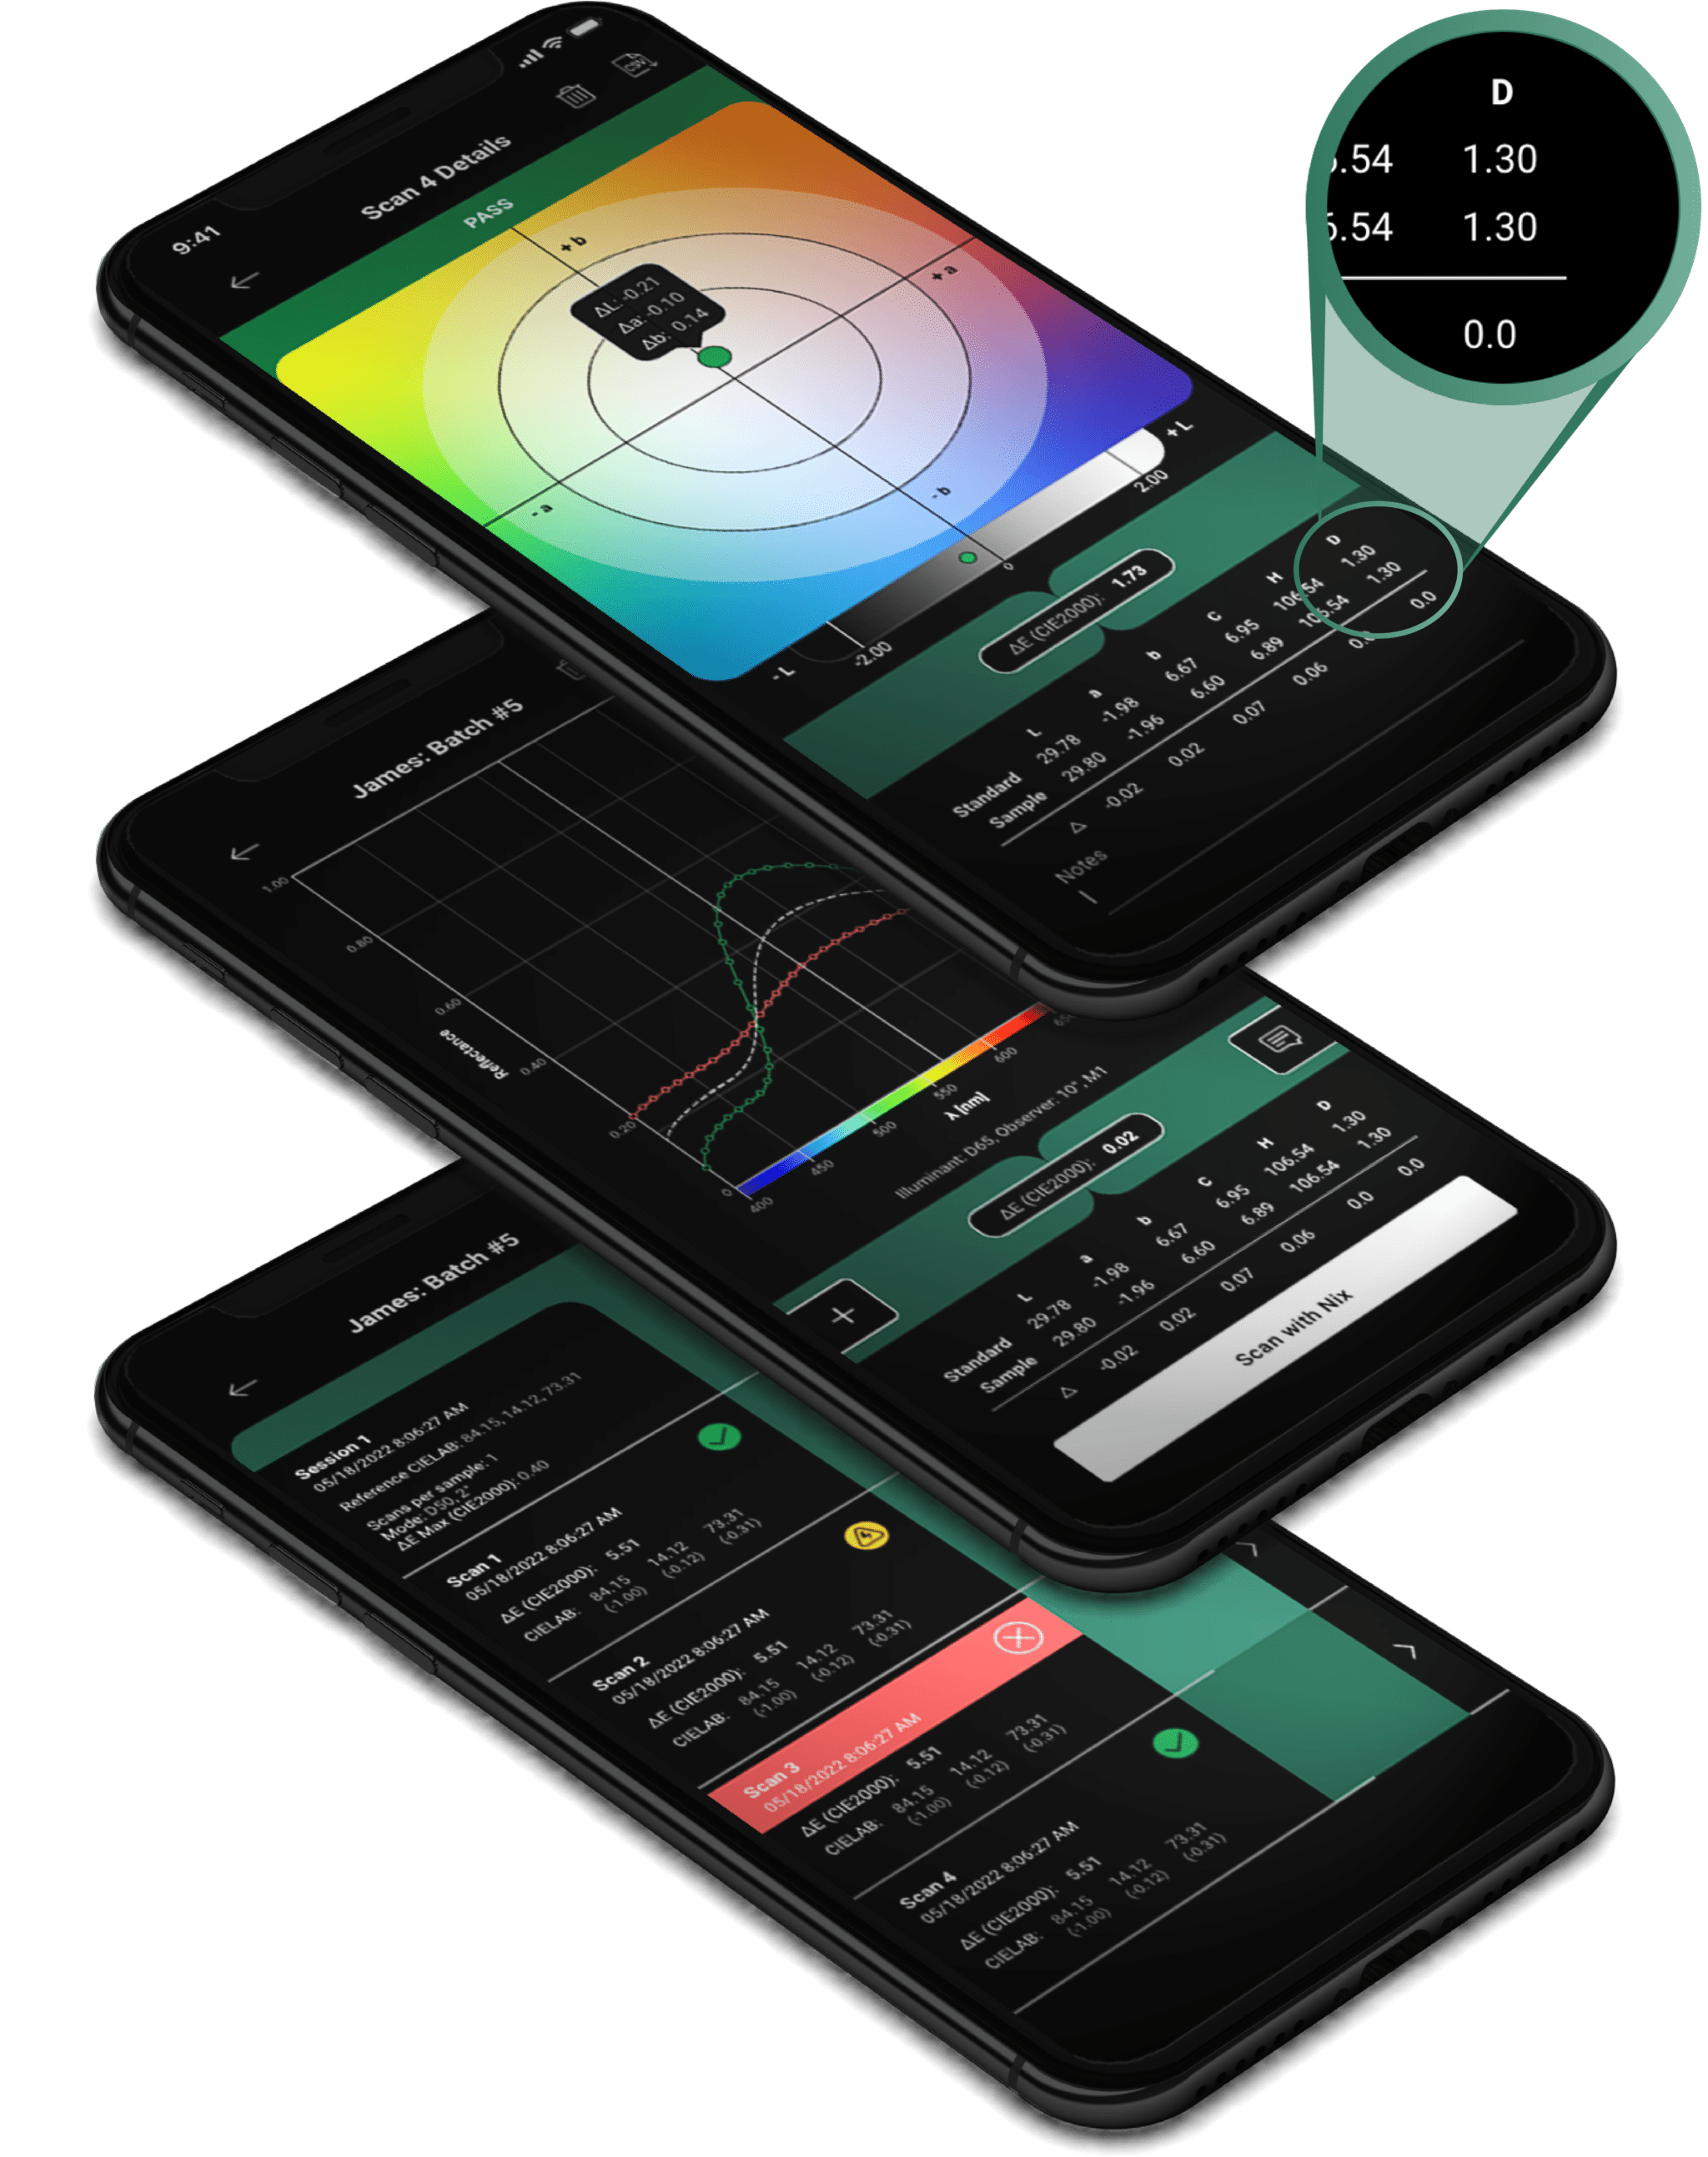
Select colors to compare by scanning samples, manually entering the digital values, or selecting a color from your saved libraries. Retrieve spectral curve comparisons as well as density readings. Any scans that do not meet your set tolerances are flagged and marked for quick identification and error prevention.
App tutorial

01 Once signed in, select our 'Quality control' tool from the Nix Toolkit app homepage. 02 Scan two samples to display their digital values (including density) and calculate the Delta E between the two swatches. Any scans that do not meet your set tolerances are flagged and marked for quick identification and error prevention. 03 Swipe your results screen to the left to retrieve the spectral curve measurements of your scan! The Delta E curve will automatically be calculated on the same graph. Zoom in and out of the graph to see the curves in more detail. Tap on a point in the curves to see their exact measurements and Delta E calculations. Select colors to compare by scanning with your Nix device, selecting from your saved libraries, or entering the digital values manually (choose from RGB, HEX, CIELAB, and more). 04 05 Through our 'Quality control history' tool, find past session histories. Retrieve scans that are marked as passing, warning, or failing. 06 Retrieve scans that are marked as passing, warning, or failing, and add notes if you'd like!

Use cases

  • Paints and coatings
  • Print and packaging
  • Vinyl siding
  • Concrete
  • Powder coating
  • Textiles
  • Fabric
  • Leather
  • Plastics
  • Wood
  • Cosmetics
  • Liquid, powder, and gel spectral sensing with additional adapters (sold separately)

Download now or browse more features